 My Patrix site
Summary view of Apple's income statement [Updated]
Since reporting on the 18th, I’ve mostly finished going over the the fourth quarter Apple data. Here is a quick summary of the articles that covered the financial and product performance:
Subject
Article
Cash
Growth
Apple’s Growth Scorecard: 63% average earnings growth over 16 quarters
iPhone pricing
The end of exclusivity doesn’t change the price operators pay for the iPhone
Sales by product
65% of Apple’s sales came from iOS powered devices
Next quarter’s estimates
Estimates for Apple’s second quarter earnings (ending March)
Share price/valuation
Is Apple a candidate for acquisition?
Margins and platform mix of profit
iOS enables 71% of Apple’s profits. Platform products power 93% of gross margin
Cannibalization
iPhone and iPad: Fine Young Cannibals?
Operational Expenses
$76 billion a year from a tableful of products
That leaves one more: Summary view of cash flows.
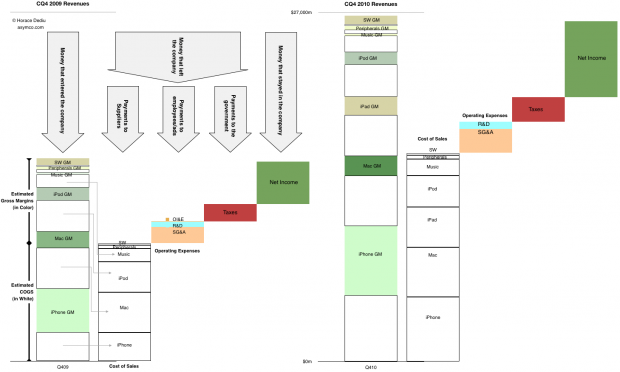
After introducing it last quarter, this is a chart that I’m trying to improve and use as a single snapshot of growth, product mix, profitability, cost structure and overall sales. The purist in me likes to see the chart clean but it can be a puzzle to some. So for the sake of explanation, this time I’ve added some annotations to the year-ago quarter.
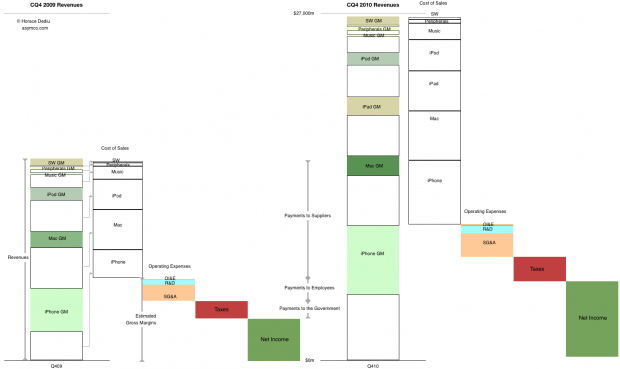
The left half shows flows in the same quarter a year ago and the right side shows the flows in the fourth quarter just ended December 2010. You can see where sales came from, how much of each product’s sales went to suppliers and how much was available to pay employees (and who got what). You can also see how much was paid in taxes and what was retained.
Please click on the figure (requires no scrolling when viewed on screens wider than 1464 pixels).
[Update] Alternate view using “waterfall”.
Comments