 My Patrix site
Hyper Tension
The iPhone 17 is the 19th generation of iPhone. The Pro Max is the 50th iPhone model and the 2TB version is the 158th variant, not including color variations. The table showing all the previous variants, models and generations is shown below.
Config #
Model #
Generation
Year of launch
Model
Memory (GB)
1
1
1
2007
iPhone
4
2
1
1
2007
iPhone
8
3
1
1
2007
iPhone
16
4
2
2
2008
3G
8
5
2
2
2008
3G
16
6
3
3
2009
3GS
8
7
3
3
2009
3GS
16
8
3
3
2009
3GS
32
9
4
4
2010
4
8
10
4
4
2010
4
16
11
4
4
2010
4
32
12
5
5
2011
4S
8
13
5
5
2011
4S
16
14
5
5
2011
4S
32
15
5
5
2011
4S
64
16
6
6
2012
5
16
17
6
6
2012
5
32
18
6
6
2012
5
64
19
7
7
2013
5C
8
20
7
7
2013
5C
16
21
7
7
2013
5C
32
22
8
7
2013
5S
16
23
8
7
2013
5S
32
24
8
7
2013
5S
64
25
9
7
2013
SE
16
26
9
7
2013
SE
32
27
9
7
2013
SE
64
28
9
7
2013
SE
128
29
10
8
2014
6
16
30
10
8
2014
6
64
31
10
8
2014
6
128
32
11
8
2014
6 Plus
16
33
11
8
2014
6 Plus
32
34
11
8
2014
6 Plus
64
35
12
9
2015
6S
16
36
12
9
2015
6S
32
37
12
9
2015
6S
64
38
12
9
2015
6S
128
39
13
9
2015
6S Plus
16
40
13
9
2015
6S Plus
32
41
13
9
2015
6S Plus
64
42
13
9
2015
6S Plus
128
43
14
10
2016
7
32
44
14
10
2016
7
128
45
14
10
2016
7
256
46
15
10
2016
7 Plus
32
47
15
10
2016
7 Plus
128
48
15
10
2016
7 Plus
256
49
16
11
2017
8
64
50
16
11
2017
8
128
51
16
11
2017
8
256
52
17
11
2017
8 Plus
64
53
17
11
2017
8 Plus
128
54
17
11
2017
8 Plus
256
55
18
12
2018
X
64
56
18
12
2018
X
256
57
19
12
2018
Xr
64
58
19
12
2018
Xr
128
59
19
12
2018
Xr
256
60
20
12
2018
Xs
64
61
20
12
2018
Xs
256
62
20
12
2018
Xs
512
63
21
12
2018
Xs Max
64
64
21
12
2018
Xs Max
256
65
21
12
2018
Xs Max
512
66
22
13
2019
11
64
67
22
13
2019
11
128
68
22
13
2019
11
256
69
23
13
2019
11 Pro
64
70
23
13
2019
11 Pro
256
71
23
13
2019
11 Pro
512
72
24
13
2019
11 Pro Max
64
73
24
13
2019
11 Pro Max
256
74
24
13
2019
11 Pro Max
512
75
25
14
2020
SE
64
76
25
14
2020
SE
128
77
25
14
2020
SE
256
78
26
14
2020
12 mini
64
79
26
14
2020
12 mini
128
80
26
14
2020
12 mini
256
81
27
14
2020
12
64
82
27
14
2020
12
128
83
27
14
2020
12
256
84
28
14
2020
12 Pro
128
85
28
14
2020
12 Pro
256
86
28
14
2020
12 Pro
512
87
29
14
2020
12 Pro Max
128
88
29
14
2020
12 Pro Max
256
89
29
14
2020
12 Pro Max
512
90
30
15
2021
13 mini
128
91
30
15
2021
13 mini
256
92
30
15
2021
13 mini
512
93
31
15
2021
13
128
94
31
15
2021
13
256
95
31
15
2021
13
512
96
32
15
2021
13 Pro
128
97
32
15
2021
13 Pro
256
98
32
15
2021
13 Pro
512
99
32
15
2021
13 Pro
1024
100
33
15
2021
13 Pro Max
128
101
33
15
2021
13 Pro Max
256
102
33
15
2021
13 Pro Max
512
103
33
15
2021
13 Pro Max
1024
104
34
16
2022
14 Pro
128
105
34
16
2022
14 Pro
256
106
34
16
2022
14 Pro
512
107
34
16
2022
14 Pro
1000
108
35
16
2022
14 Pro Max
128
109
35
16
2022
14 Pro Max
256
110
35
16
2022
14 Pro Max
512
111
35
16
2022
14 Pro Max
1024
112
36
16
2022
14
128
113
36
16
2022
14
256
114
36
16
2022
14
512
115
37
16
2022
14 Plus
128
116
37
16
2022
14 Plus
256
117
37
16
2022
14 Plus
512
118
38
17
2023
15 Pro
128
119
38
17
2023
15 Pro
256
120
38
17
2023
15 Pro
512
121
38
17
2023
15 Pro
1024
122
39
17
2023
15 Pro Max
256
123
39
17
2023
15 Pro Max
512
124
39
17
2023
15 Pro Max
1000
125
40
17
2023
15
128
126
40
17
2023
15
256
127
40
17
2023
15
512
128
41
17
2023
15 Plus
128
129
41
17
2023
15 Plus
256
130
41
17
2023
15 Plus
512
131
42
18
2024
16 Pro
128
132
42
18
2024
16 Pro
256
133
42
18
2024
16 Pro
512
134
42
18
2024
16 Pro
1024
135
43
18
2024
16 Pro Max
256
136
43
18
2024
16 Pro Max
512
137
43
18
2024
16 Pro Max
1024
138
44
18
2024
16
128
139
44
18
2024
16
256
140
44
18
2024
16
512
141
45
18
2024
16 Plus
128
142
45
18
2024
16 Plus
256
143
45
18
2024
16 Plus
512
144
46
18
2024
16e
128
145
46
18
2024
16e
256
146
46
18
2024
16e
512
147
47
19
2025
17
256
148
47
19
2025
17
512
149
48
19
2025
Air
256
150
48
19
2025
Air
512
151
48
19
2025
Air
1024
152
49
19
2025
17 Pro
256
153
49
19
2025
17 Pro
512
154
49
19
2025
17 Pro
1024
155
50
19
2025
17 Pro Max
256
156
50
19
2025
17 Pro Max
512
157
50
19
2025
17 Pro Max
1024
158
50
19
2025
17 Pro Max
2048
Each of these models had a starting price (unlocked, US Apple store price in USD, before taxes, subsidies, etc.) The price and duration of sales period are shown in the following diagram (click on picture for full-size view.)
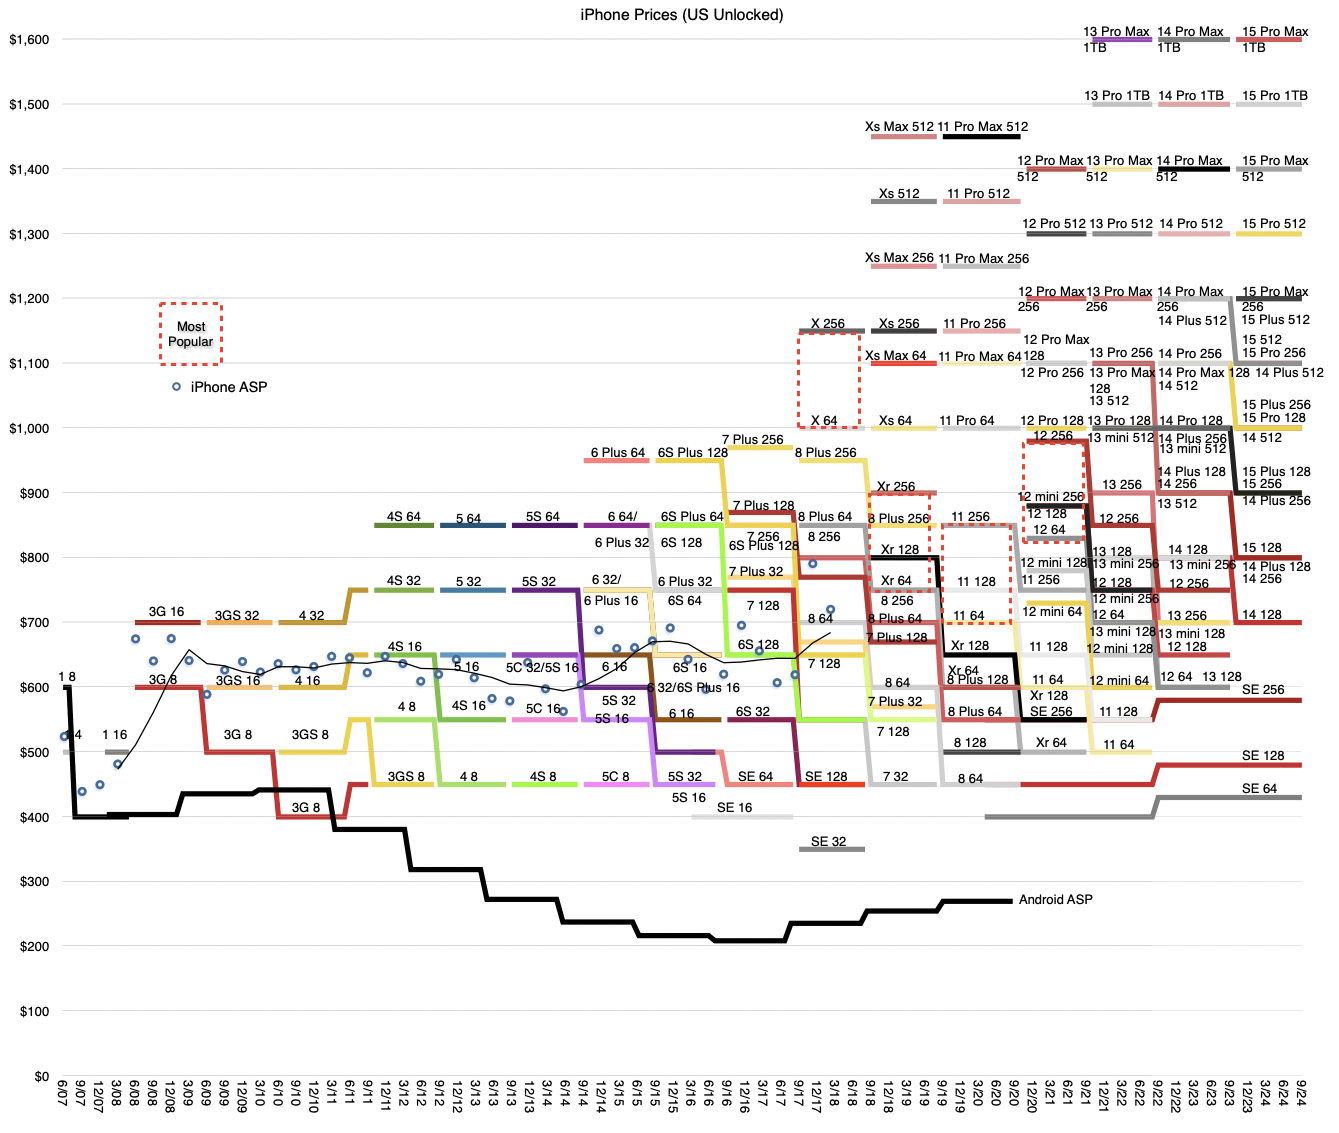
The eye is naturally drawn to the upper right corner where the new top-of-the-line iPhone 17 Pro Max 2TB variant is priced at $1999. This is not unexpected as the introduction of higher memory or “Pro” variants has broadened the upper end of the price range in a more-or-less regular cadence. Historically these increases were every three years but we’ve now gone four without a jump.
However, the delay is made up for by a significantly higher gap up. Only in 2018, with the launch of the Xs, did we see as significant a jump ($400) as we did today. Unlike in 2018, there are no other variants filling the gap. There is no $1899 iPhone or a $1799 or $1699 either. The next model is the 17 Pro Max 1TB at $1599. It also happens to be the same price as the 16 Pro Max 1TB, as indeed all the other 16->17 upgrades kept the same price.
The price “slots” are all filled nicely including with the typical decrease in price by $100 for year-old variants, the 16 Plus 256, 16 Plus 128 and 16 128. Since the SE was withdrawn last spring, the entry point for a new iPhone is down to $599, now the “floor” of the price band.
And so the “stairway to heaven”, as this graph came to be known persists. It’s a graduate level thesis on pricing which speaks volumes on pricing power, especially relative to the Android alternatives and to almost every other consumer electronics category. I won’t repeat the observations made about this pattern over the years but I will say that the point Apple wishes to make is that if you want an iPhone, there is one at every price you can afford, and used ones are still available well below the floor new iPhones sell at. By stretching the band upward, it provides greater storage and more functions bundled to those who really need it.
However, one problem with this graph is that it does not account for inflation. Taking the month of June 2025 (the last for which data is available,) the adjustment for 2007 is 1.53. In other words prices now are are 53% more expensive (as are wages, mostly). If we were to present the pricing data at constant June 2007 dollars, it would look like this:
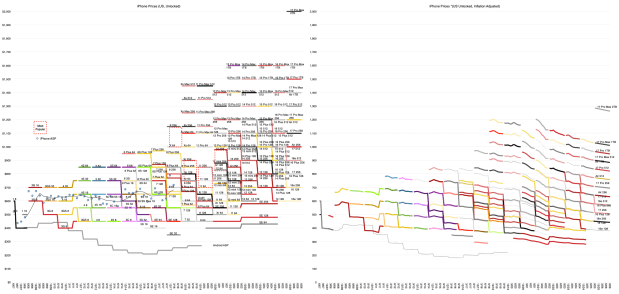
Note that I am showing the unadjusted and adjusted graphs next to each other so that a comparison can be made at a glance. The density of the data does not permit the labeling of the adjusted graph in its entirety and the hundreds of lines needed cannot be made consistent in color across the two graphs.
Nonetheless, the inflation adjusted data is startling. Excluding the 2TB outlier, the inflation adjusted graph is peaking at around $1000 with the median below $700. Shockingly, that median is almost exactly the same as the iPhone 3G’s launch price of 2008 and one can visually trace a line across the whole graph maintaining this average selling price to the present. The outlier $1999 2025 iPhone would be a $1300 2007 price point. Not cheap but it exceeds in storage and performance any laptop costing $4000 back then.
From its inception, the iPhone was labeled “expensive”, “exclusive” or “premium,” somehow not for everyone. But 3 billion sold and 1.5 billion users later this is obviously wrong. It is very much a mainstream product. Almost 1 in 5 human beings on the planet are using it [although it be the wealthiest 20%]. But it did not get there by lowering prices. Not even for those living in countries with far lower income levels. It got there by keeping prices steady while improving performance exponentially and adding new measures of performance that nobody asked for but everyone wanted.
There is something quite extraordinary about this product. And it’s not anywhere near being done improving. It still elicits an increase in heartbeat and a dilation of the pupils. I always said it’s in the market for hormones.
Speaking of, the same price band analysis can be applied to the iPad, Mac, and AirPods. Not yet to the Vision Pro, which tells you something. But the Watch, that’s another classic segmentation story. Now it seems to be ready to diagnose the rise in blood pressure you’re likely to get by looking at these graphs.
Comments