 My Patrix site
The Composition of Active Devices
Measuring the future
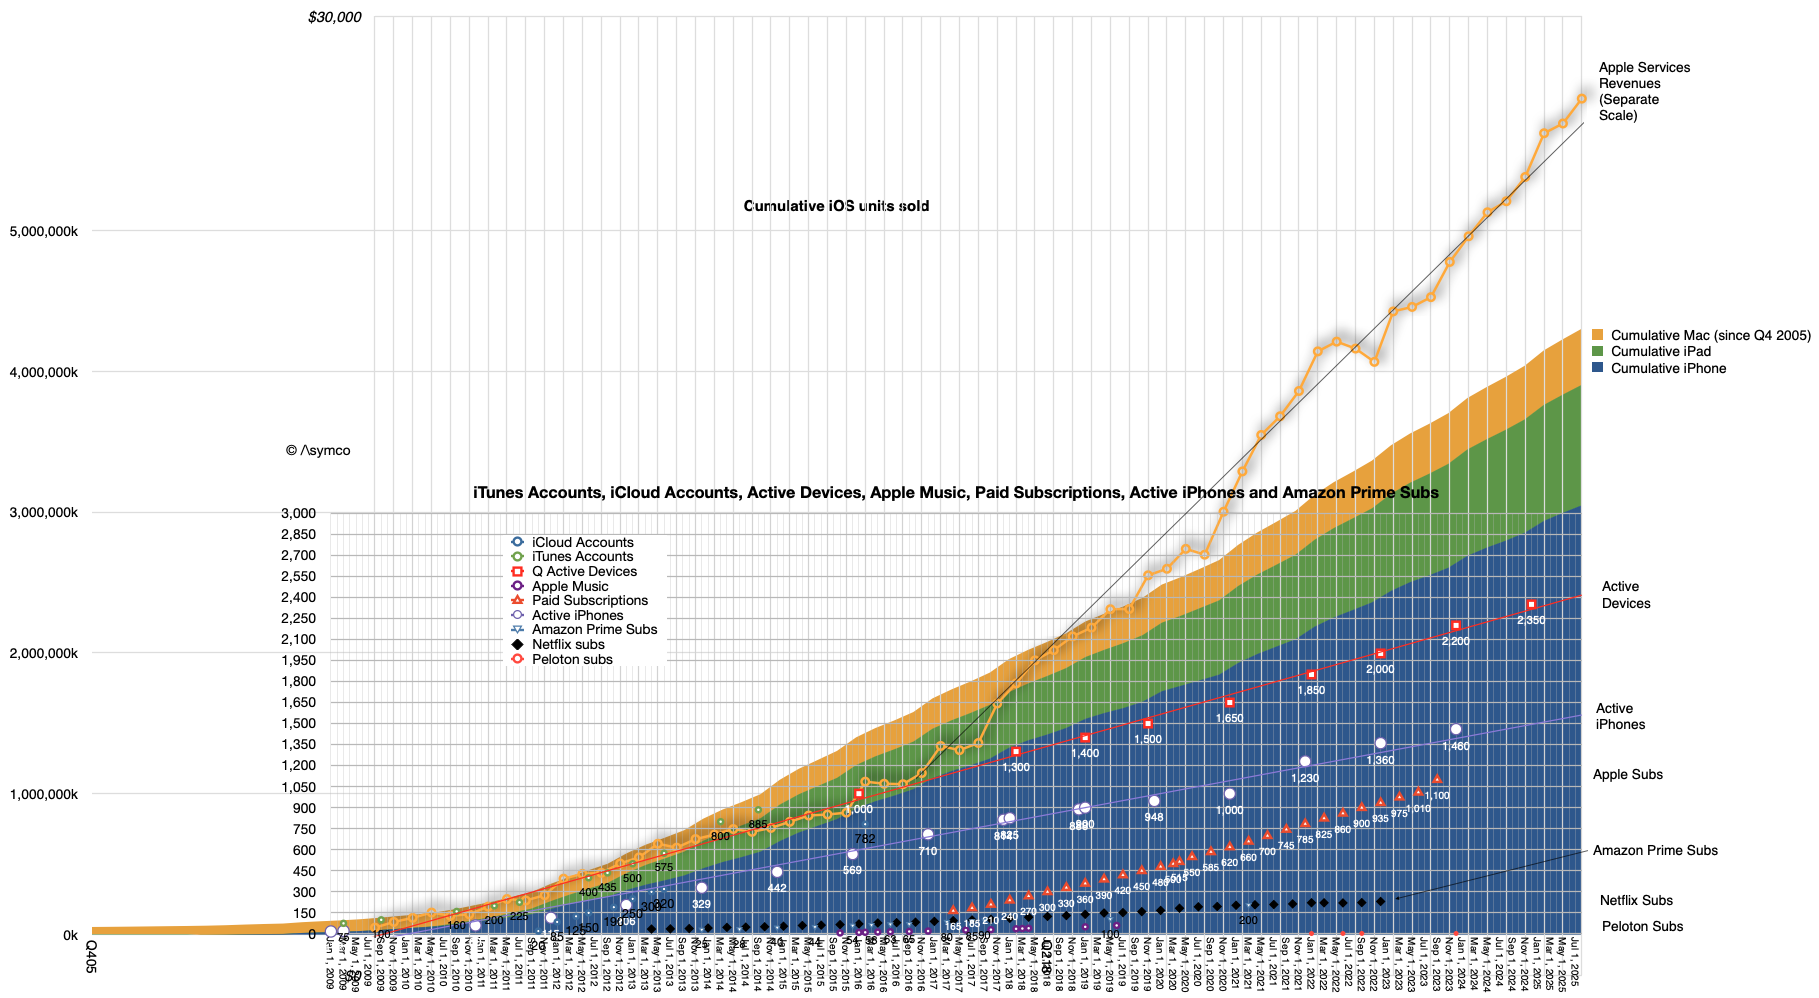
In January this year Apple reported that there were 2.5 billion active Apple devices in use. This figure has been getting updated for years and I’ve been reporting its trajectory and other measures that are correlated to it. For instance the number of Apple subscriptions, Apple Services revenues and other historical indicators such as iCloud accounts and Apple Music.
Simplifying, I published the “ACTIVE” model which makes some basic projections of this total device count and it’s shown below”
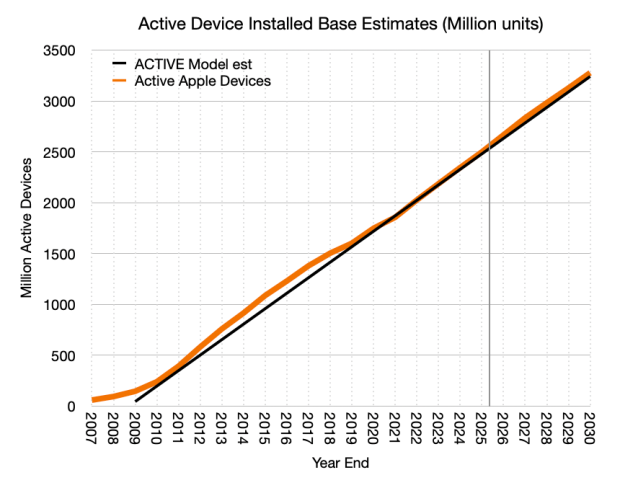
One element of the analysis that has eluded me was the more precise composition of this total “devices”. In other words, which devices and what is their mix. We have seen numbers for iPhones but not for other types of devices. I should note that this is not easily derived because we have neither the units sold (only revenues) and we don’t know how long they stay in use. The measure of active population implies that the products are bought, used and eventually retired.
The only clue we have, beside quarterly revenues–and even there wearables and home are not separated by product–is that management occasionally mentions that “more than half” of buyers of a specific product are “new to the product”. It’s not much to go on.
But there are other data sets we can tap. StatCounter provides a share of platforms in use by aggregating browser identifying data for a moderately large set of web sites. That may help with share of base but not with how much the total base is. Various other analysts do try to summarize some of the installed base for particular dates.
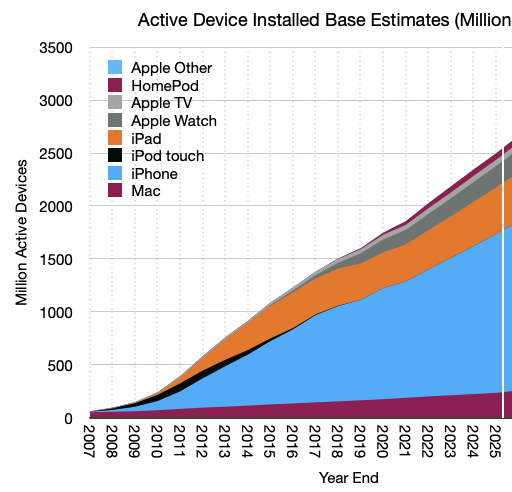
Combining all the available data and some interpolation, I set out to do is to provide a yearly count of the population of Apple devices for each year since 2007. Then to try to forecast this population to 2030. The result is shown below:
The following is a summary for the components for the end of 2025 in millions:
Year-end
Mac
iPhone
iPad
Watch
Apple TV
HomePod
Other
2025
233
1500
442
203
58.5
61.75
0.5
This history looks like this:
What about the future? Let’s dig in.
The rest of this post is for Asymco members. Continue reading on asymco.com.
Comments