 My Patrix site
Is a Crash Coming?
A Series on Valuation in the age of AI
Apple recently hit an all-time high. Today the stock is trading at a P/E of 35. The P/E ratio is the current share price P divided by the last four quarters’ net earnings per share E. But we also have a pretty good idea of the earnings for the next quarter, ending June (now almost half-way completed). The guidance very clearly suggests that on a one Quarter forward basis the P/E ratio is 34.
I’ve maintained for at least 15 years that a reasonable multiple for Apple is 35. This was mainly because other large cap technology companies were also trading around that number. While at this ratio, if a company is growing at 22% it means that an investor will make their money back in about 10 years. Thereafter all free cash flows will go entirely to the investor’s pocket. That seems a reasonable return. It’s not a particularly risky bet to assume 20% growth for 10 years if you look at (a) history and (b) how many people in the world have not yet started using Apple products and (c) assess how well management is doing their job.
So by this measure, Apple seems to be reasonably priced. Historically it has not been reasonably priced but that is due to the disconnect between understanding the business and falling for the usual false tropes. The following graph shows the share price and where it fell between the bands of Earnings multiples. The grey areas represent periods of significant share price decline.
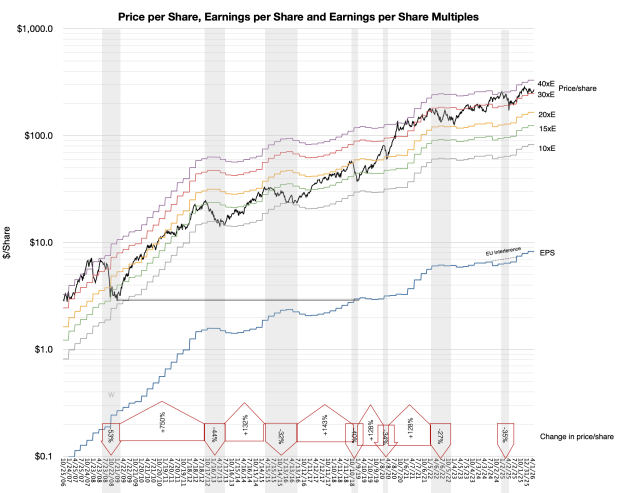
But much of the volatility of the stock is also due to overall sentiment collapse. That has happened on many occasions, most notably the 2008 financial crisis and “great recession.” (Another was the Covid crisis.) In these cases, regardless of underlying strength, the shares were available very cheaply.
Today perhaps we should ask if a bubble is forming due to exuberance around AI which is inflating the market in unsustainable ways.
There are four reasons why the current asset value explosion is different.
First, it is highly concentrated in a handful of names.
2005 S&P 500 top 10
% of the S&P index
2026 S&P 500 top 10
% of the S&P index
Exxon
3.1%
NVDA
7.8%
MSFT
2.5%
GOOG
7.3%
Citigroup
2.2%
AAPL
6.4%
GE
2.0%
MSFT
4.6%
Walmart
1.7%
AMZN
4.4%
BoA
1.6%
Broadcom
3.0%
J&J
1.6%
TSLA
2.4%
Pfizer
1.4%
META
2.3%
Intel
1.3%
Walmart
1.6%
AIG
1.3%
Berkshire Hathaway
1.5%
Total
18.7%
41.3%
Second it is fueled by equity not debt. Third, it involves disproportionate capital expenditure rather than M&A. Fourth it is accompanies by sharply growing revenues (though not as sharp as investment growth.)
In other words, whereas the equity value is growing rapidly, so is income and investment without leverage. This is a low-debt with high income scenario. Previous crises were high income with high debt (2008) or low income with low debt. (Dot Com).
That’s not to say that we have uniform fair equity values. We need to do quite a bit more due diligence to determine the state of the valuations precisely because we have unusual capital allocation strategies.
To cover this topic I’ll will break the analysis into multiple posts. They are:
- Why the most common metrics for valuation are insufficient — the problem with the P/E ratio
- What are the alternatives that into consideration exceptional cash and capital expenditures — The EV/FCF ratio
- How does the P/E ratio differ from EV/FCF and what does it mean if they diverge one way or another
- How do the Mag 7 et. al. appear on these Metrics
- How to complement snapshots like valuation ratios with the time series of fundamentals
- Why payback measures are the ultimate measure of valuation
- What are the current payback measures for the Mag 7 et.al.
- Compare Apple to its peer group
- Finally assess whether a collapse in confidence is imminent
Please return to these pages in the next few days to read these posts.
Comments