 My Patrix site
42% of Apple Analysts rate it a Hold or Sell
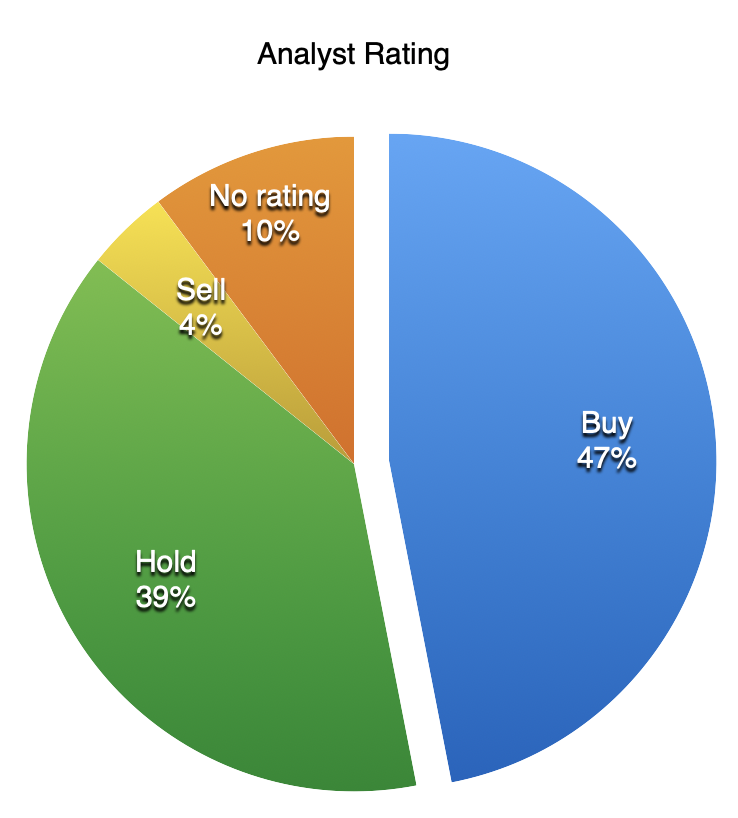
Another 10% do not provide a rating.
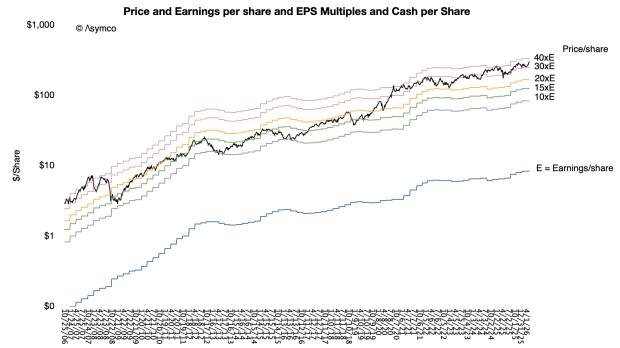
Over the past 20(!) years, Apple net income has grown at a compounded annual growth (CAGR) of 26.6%, Revenue growth has compounded at 21.5% and share price has compounded at at 27.7%. That means the company has been doubling at least every 3 years for more than 20 years.
The graph below shows share price and yearly earnings (and multiples of those earnings) since 2006. Note the vertical scale is logarithmic. The Price line has been growing at 27% or doubling every 2.6 years. The exercise of predicting the share price based on extrapolation is left to the reader.
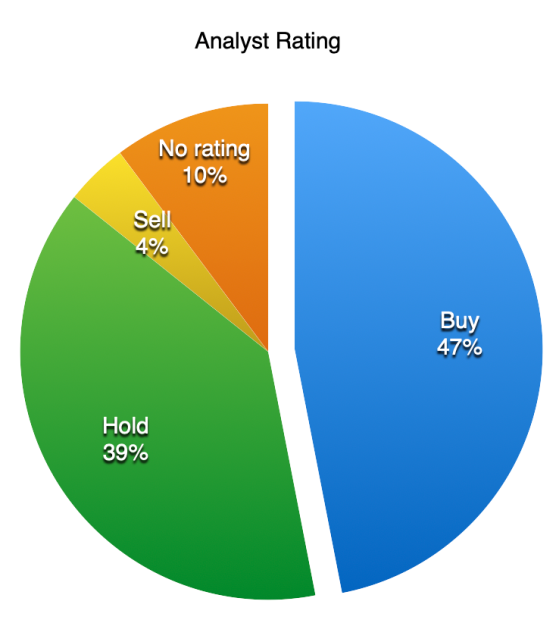
In spite of this, data shows that 21 out of 49 analysts who follow Apple have the equivalent of a “Hold” or “Sell”. An additional 5 follow it but have no opinion.
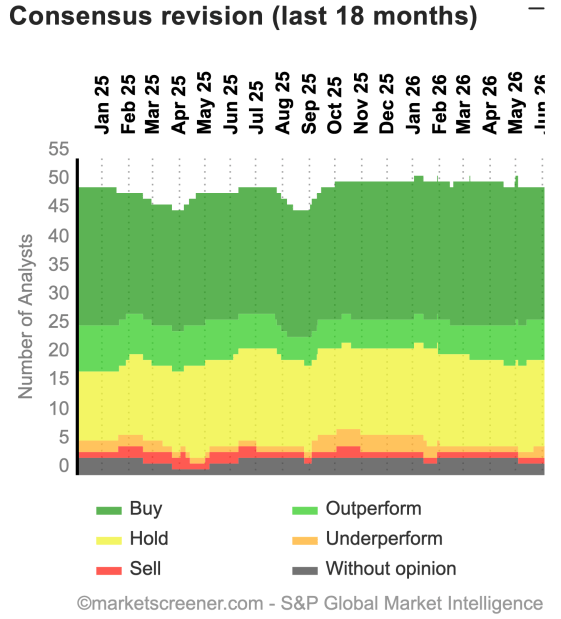
It takes significant courage to predict a reversal of a 20 year trend. That a majority of analysis implicitly or explicitly believe Apple is on the precipice of failure may come as a surprise given the recent rise in price and optimism around AI. The graph shows the percent of Hold/Sell/Underperform/no opinion has been rising.
The graph below shows the targets published recently.
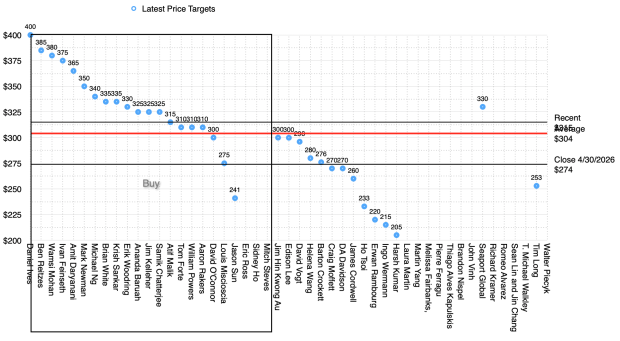
The targets are sorted by rating and then value. The “Buy” rated are encapsulated, the rest have all the other ratings. The Red line is the average of all ratings. Some of the ratings and targets, especially the lowest, are out of date.
The rest of this post is for Asymco members. Continue reading on asymco.com.
Comments