 My Patrix site
Why iPhones prices don’t change
Exponential increase in performance at a flat price. Is the formula about to change?
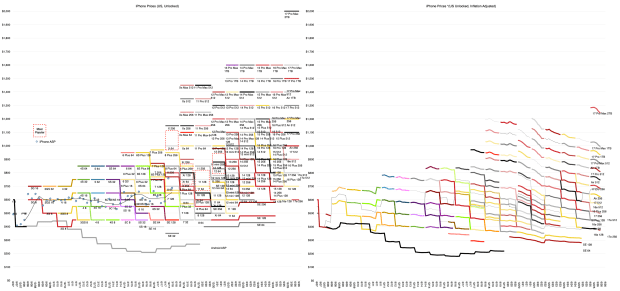
The iPhone price structure is very carefully constructed. One could even say it’s engineered. It has operated under many constraints: segmentation, margin, scale and market windows. The balance between these and other constraints has been managed for 19 years. The left-hand graph above shows the pricing of all iPhones ever sold in constant dollars. The right-hand graph shows the pricing adjusted for US (CPI) inflation.
Until 2021 inflation was not a major factor but following the Covid perturbation the iPhone pricing fell dramatically. To see the picture more clearly, I show the median price below:
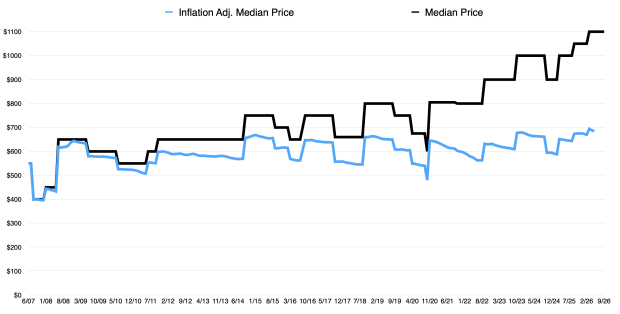
The median is the point where half the prices are above and half are below. It’s not the average selling price (ASP)1. The black line is the constant dollar median and the blue is the inflation-adjusted median.
Note that the inflation-adjusted median has remained in the $500 to $700 point since 2012. In fact the average median is $597 over the entire 19 years.
But what does the median represent? It’s the midpoint of the price range. It’s not adjusted by volume. If more people buy the expensive models then the ASP is higher and vice versa. To test this, I compared the known ASP data with the median to see the relationship.
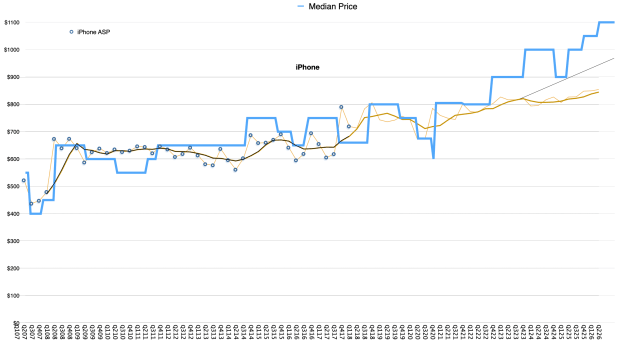
The dotted line represents actual data and the un-dotted yellow line is my own approximation of the ASP since then. Clearly the data shows that until 2018 the median was a good proxy for the ASP. Perhaps since then the ASP has been lower than the median price but it’s predictable.
But if adjusting for inflation, the ASP should be also quite flat over the entire period. It’s a remarkable observation.
The iPhone has grown in capabilities exponentially but the price has remained the same.
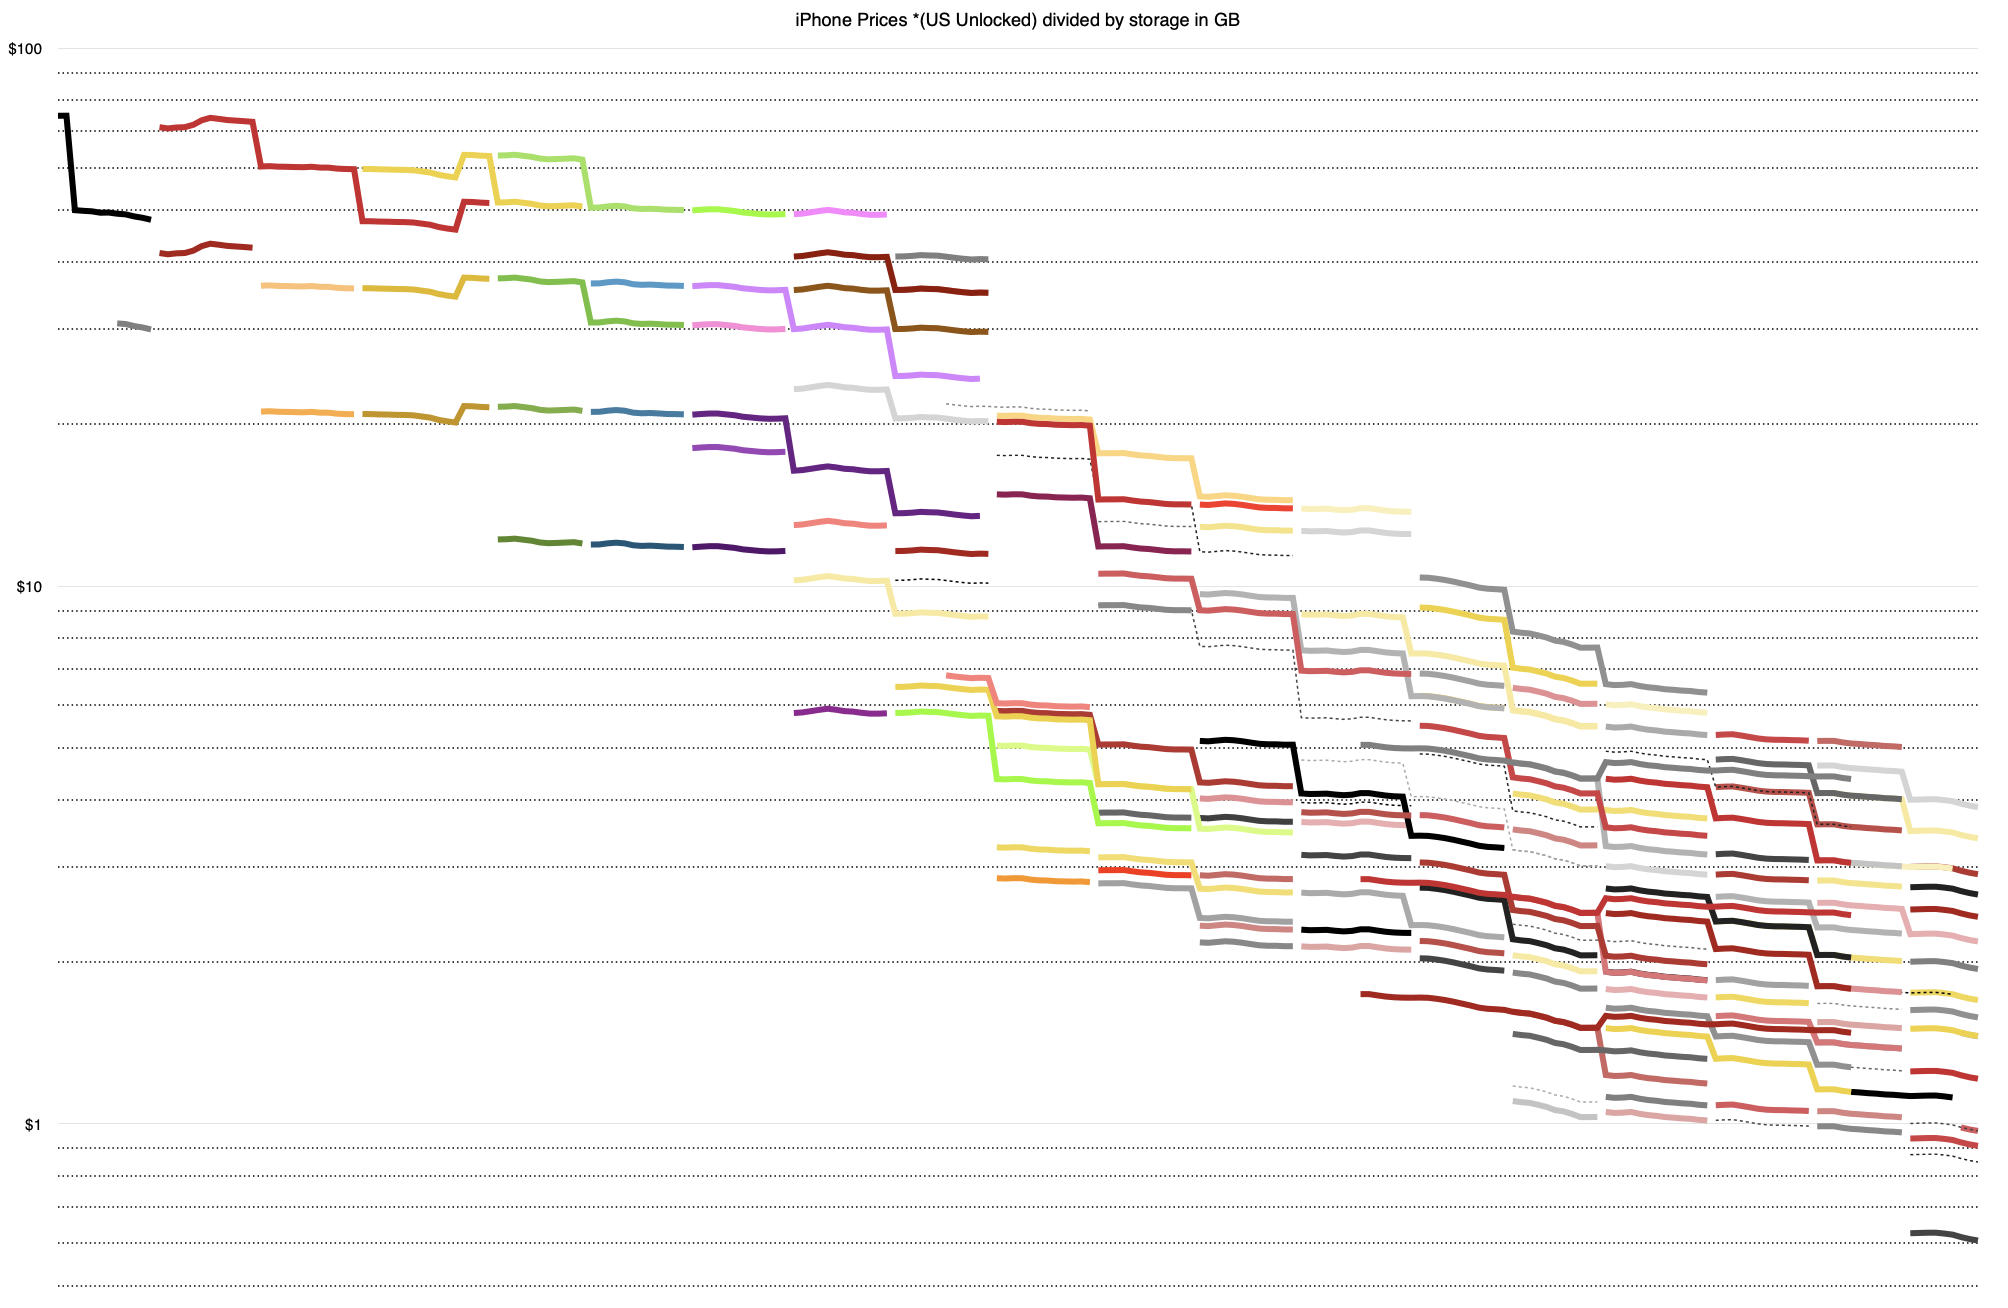
To illustrate, I considered the storage provided by each iPhone in the list (all 160 models). They span 4GB to 2048GB. If we divide the inflation-adjusted price by the storage we get adjusted dollars/GB and the graph for all iPhones is shown below
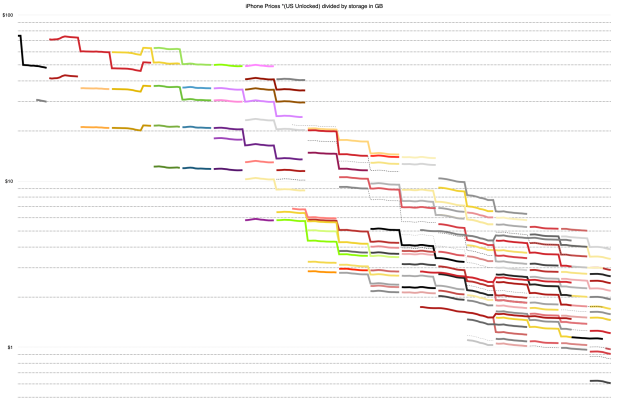
Note that this is a logarithmic scale. The pricing went from $75/GB with the iPhone (1) to about $1/GB with iPhone 17. A two-orders-of-magnitude reduction.
Taking the median of these prices per GB and plotting on a linear scale gives the following picture.
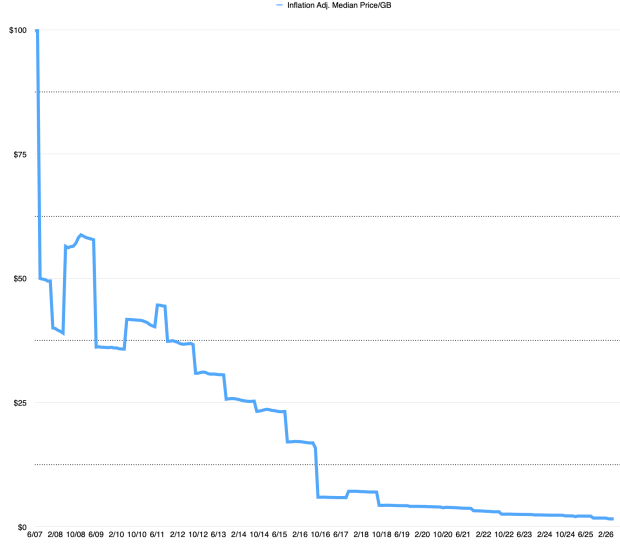
One of the accusations against Apple is that the iPhone is not much more than a storage device and Apple just charges a mark-up on memory. The higher prices are just deeper gouging of not-much-more expensive memory. The graph above shows how improbable this is. Though storage is one measure of performance, there are many others and the increases in density are passed through to the consumer.
The appetite for memory has grown exponentially and fortunately the pricing has dropped exponentially, yielding essentially a flat price for an exponentially improving product.
Which brings me finally to the point.
The rest of this post is for Asymco members. Continue reading on asymco.com.
Comments