 My Patrix site
How to maintain a Sell rating on Apple
One simple trick.
Tim Long of Barclays Bank has an underweight (Sell) rating on Apple shares. Apple shares have just hit an all-time high. Perhaps he’s right. Perhaps one should sell high.
The problem is that Tim Long has had a sell or hold rating on Apple for many years. As far as my data shows, Barclays downgraded Apple shares to a “hold” equivalent on February 20, 2014. In that instance, Barclays analyst Ben Reitzes shifted his rating from “overweight” to “equal weight” due to expectations that upcoming hardware products would not be enough to further move the needle. More recently, on January 2, 2024, Barclays analysts further downgraded Apple shares to “underweight” (a sell equivalent).
Ben Reitzes with Barclays Capital today stripped away his Overweight rating on shares of Apple (AAPL), a rating he’s had for a decade, while maintaining a $570 price target, writing that the various products that one can imagine from the company — a smart watch, or a television set — won’t be enough to move the needle, so to speak, for the company.
The price target in February 20, 2014 was set to $570 which, accounting for a 7 to 1 spent in June 9, 2014 and 4 to 1 in August 31, 2020, would be $20.39 today (On February 20, 2014, the date of the new $20 target and downgrade, Apple shares closed at $16.54. A year later the shares were $28.77.)
Thus the recommendation from Barclays has been to sell low for 12 years.
Let’s dig in.
Nearly a year ago, on August 1st, 2025 Barclays adjusted their price target on Apple to $180 From $173. Today the share price is around $317. We still have a few weeks before August 1st so there is time for the price to fall to $180, however, here are additional 30 price targets set by Barclays and the corresponding price of shares a year later allowing us to evaluate performance:
Date of Target Set
Target
Price one year later
Error
4/30/25
$173
$271
-56.8%
1/31/25
$197
$270
-37.1%
1/22/25
$183
$248
-35.7%
11/1/24
$184
$269
-46.2%
8/2/24
$186
$203
-9.3%
7/24/24
$187
$214
-14.3%
5/3/24
$165
$199
-20.5%
2/2/24
$158
$228
-44.3%
1/2/24
$160
$243
-52.1%
11/3/23
$161
$222
-37.9%
10/30/23
$166
$234
-40.8%
8/4/23
$167
$209
-25.3%
4/26/23
$149
$170
-14.0%
2/3/23
$145
$188
-29.4%
1/11/23
$133
$186
-39.5%
11/7/22
$144
$182
-26.3%
10/28/22
$156
$170
-9.2%
10/10/22
$155
$178
-15.1%
7/29/22
$169
$196
-16.2%
7/13/22
$166
$191
-14.8%
4/29/22
$167
$170
-1.6%
3/11/22
$170
$150
11.5%
1/28/22
$169
$143
15.4%
10/29/21
$145
$153
-5.8%
7/28/21
$142
$157
-10.8%
5/19/21
$134
$137
-2.5%
4/29/21
$138
$158
-14.2%
1/28/21
$136
$170
-25.2%
1/14/21
$116
$173
-49.2%
10/30/20
$100
$149
-49.0%
The graph version of this data is shown below:
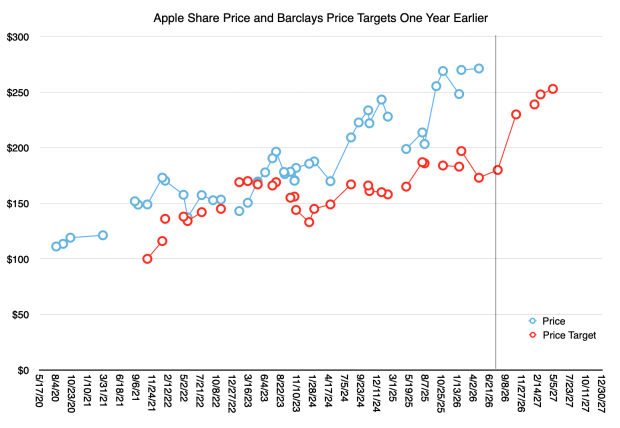
Today is shown with a vertical line.
The graph speaks for itself. The average error is 30%. The worst is 57%. Putting aside the gross failure in setting targets, the most curious aspect of this coverage is that the price targets are trending upwards quite consistently while the ratings are coming down.
The rest of this post is for Asymco members. Continue reading on asymco.com.
Comments